Kubernetes: Powerful, But Deceptive
Kubernetes gives us powerful abstractions: deployments, services, autoscalers, ingresses. But these layers of convenience hide deep operational truths — from unpredictable cost spikes to silent security flaws and performance bottlenecks.
Your Kubernetes dashboard might be green, but your cluster could be burning.
This article will uncover:
Where Kubernetes abstracts too much
How you’re missing real-time signals in logs and metrics
Tools and commands to surface the truth (Prometheus, kubectl, OPA, Goldilocks, KubeCost)
How to engineer with radical visibility instead of blind trust
Lie #1: "Your Resources Are Right-Sized"
Most engineers set resource requests/limits based on guesswork or defaults.
But the actual usage? Often 10x different.
Truth Command:
Compare this output with what you set. If your pods are using 5% of what’s requested, you’re wasting money.
Use Prometheus Query:
Tool Recommendation:
Goldilocks suggests optimal requests/limits based on historical usage.
Lie #2: "Everything Is Secure By Default"
Kubernetes won’t stop you from:
Running privileged containers
Pulling images over HTTP
Mounting host paths
Exposing internal services externally via LoadBalancer
Truth Command:
Use OPA (Open Policy Agent) + Gatekeeper:
Block dangerous patterns via policies like:
Tool Recommendation:
Kube-Bench for CIS compliance checks
Trivy for image scanning
Lie #3: "Autoscaling Keeps You Efficient"
Horizontal Pod Autoscaler (HPA) is only as smart as the metric it uses. Most clusters default to CPU usage.
What if your app is memory-bound? Or latency-sensitive?
Truth Command:
Check the metric type:
Tool Recommendation:
KEDA (Kubernetes Event-driven Autoscaling) to scale on custom metrics
Prometheus Adapter to expose app-level metrics to HPA
Lie #4: "Your Cluster Costs Are Transparent"
Kubernetes billing is fragmented:
Node cost (EC2, VM, etc.)
EBS volumes
Network egress
Load balancers
Wasted pod capacity
Use KubeCost:
Visualize cost per:
Namespace
Deployment
Team label
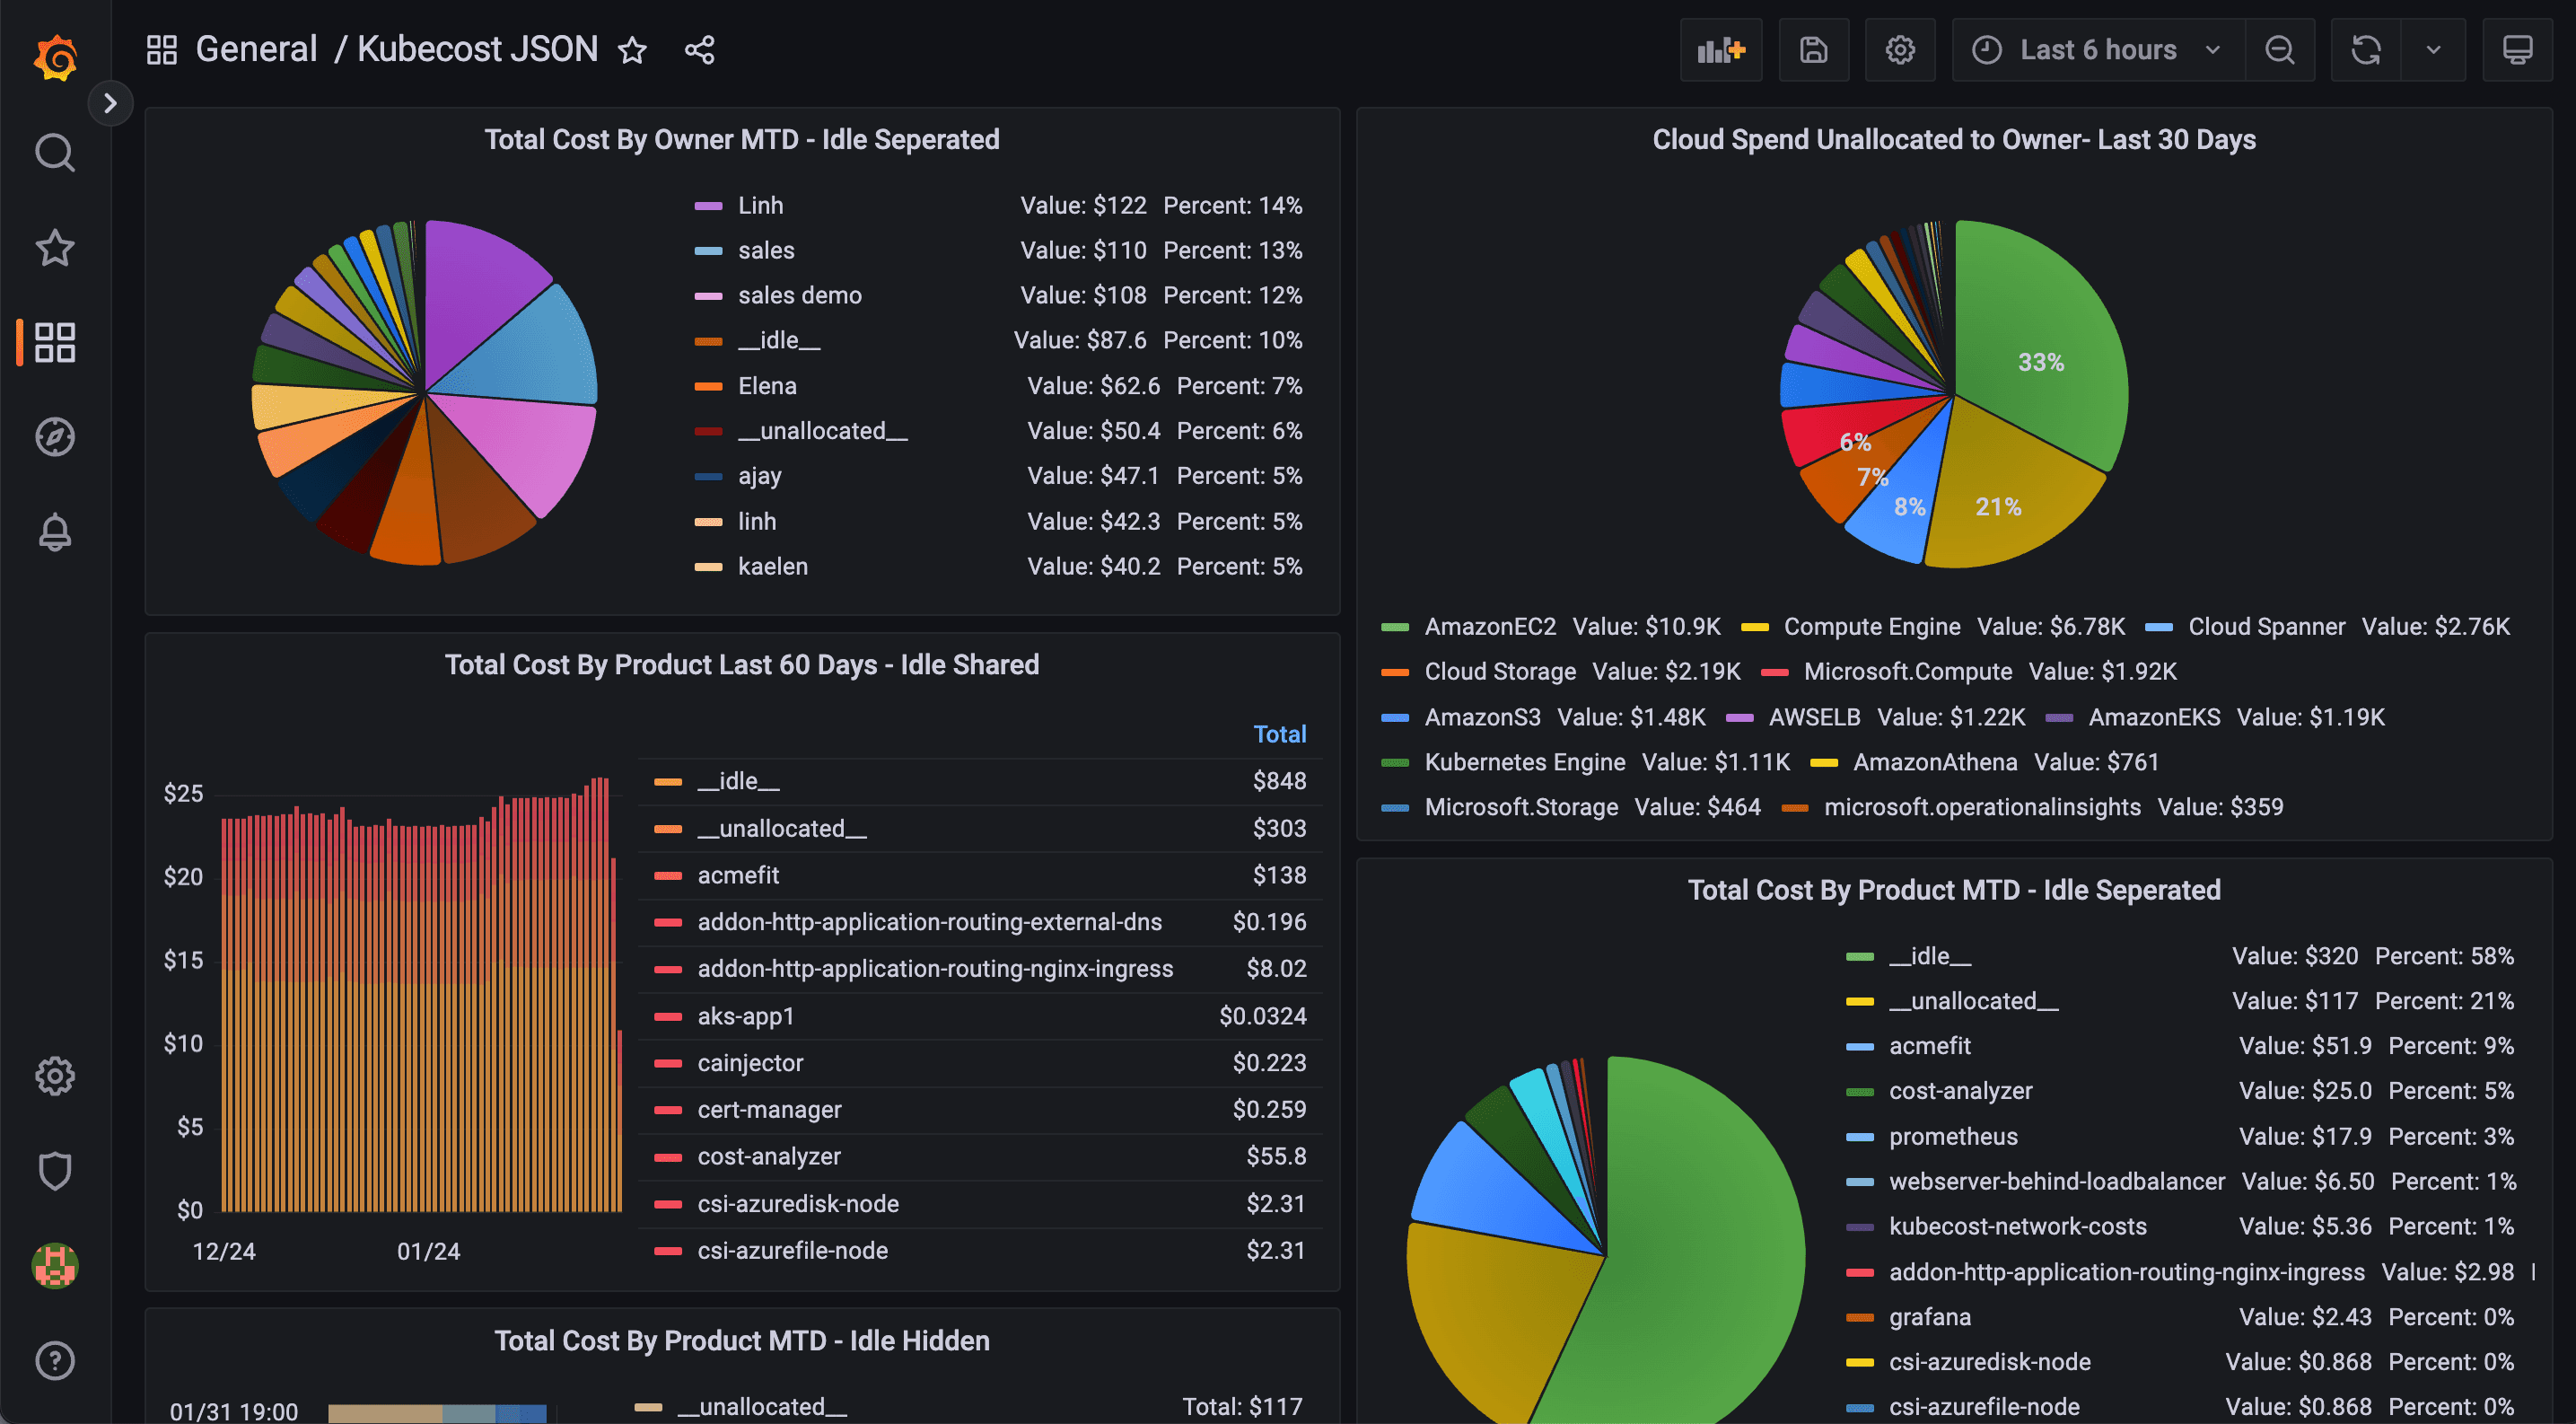
Quick Audit:
Compare allocatable vs usage. Unused = wasted spend.
Lie #5: "Your Cluster Is Healthy If the Dashboard Says So"
Kubernetes probes only check liveness/readiness. They don’t tell you:
If your pods crash-loop 10x per hour
If your ingress latency spiked
If an app returns 500s 50% of the time
Logs That Matter:
Tools:
Loki for log aggregation
Jaeger for distributed tracing
Sentry or OpenTelemetry for app-level errors
How to See the Truth
Concern | Tool | Command or Action |
|---|---|---|
Resource waste | Goldilocks | Analyze requests/limits |
Costs | KubeCost | Cost by namespace/team |
Security | OPA, Trivy | Block privileged containers |
Autoscaling | KEDA + Prometheus | Scale on latency/queues |
Logging | Loki, Sentry | Centralized alerting logs |
Final Takeaway
Kubernetes is brilliant at making things run. But it’s not designed to tell you:
What it’s costing you
Whether it’s secure
If you’re over-provisioned
Or whether your app is actually healthy
You can’t fix what you can’t see.
Treat Kubernetes as a powerful engine. But install the sensors, meters, and guardrails yourself.
Because clusters don’t lie maliciously — they just don’t volunteer the truth.
NEVER MISS A THING!
Subscribe and get freshly baked articles. Join the community!
Join the newsletter to receive the latest updates in your inbox.